Urban Forest Change Detection & Reforestation Suitability
Client: Confidential Institutional Partner (Toronto)
The Challenge
An urban institutional campus needed a clear picture of how their forest canopy was changing over time. They required an assessment of tree growth, storm damage, and overall structural loss, as well as guidance on the best native species to plant for future resilience.
The main difficulty was separating actual biological changes in the trees from the background “noise” caused by using different LiDAR survey equipment across different years. We also needed to combine this 3D mapping data with on-the-ground soil surveys.
The Solution
We combined spatial analysis with field ecology to provide a clear, accurate picture of the campus forest.
- Historical Alignment: We carefully aligned the multi-year LiDAR datasets to a shared grid. This eliminated sensor errors and ensured that any detected changes were physically real.
- Canopy Change Mapping: We calculated exact areas of structural shift, isolating where biomass was gained and where canopy was lost.
- Soil & Species Integration: We layered these structural maps with field-collected soil data to understand why certain areas were thriving or failing.
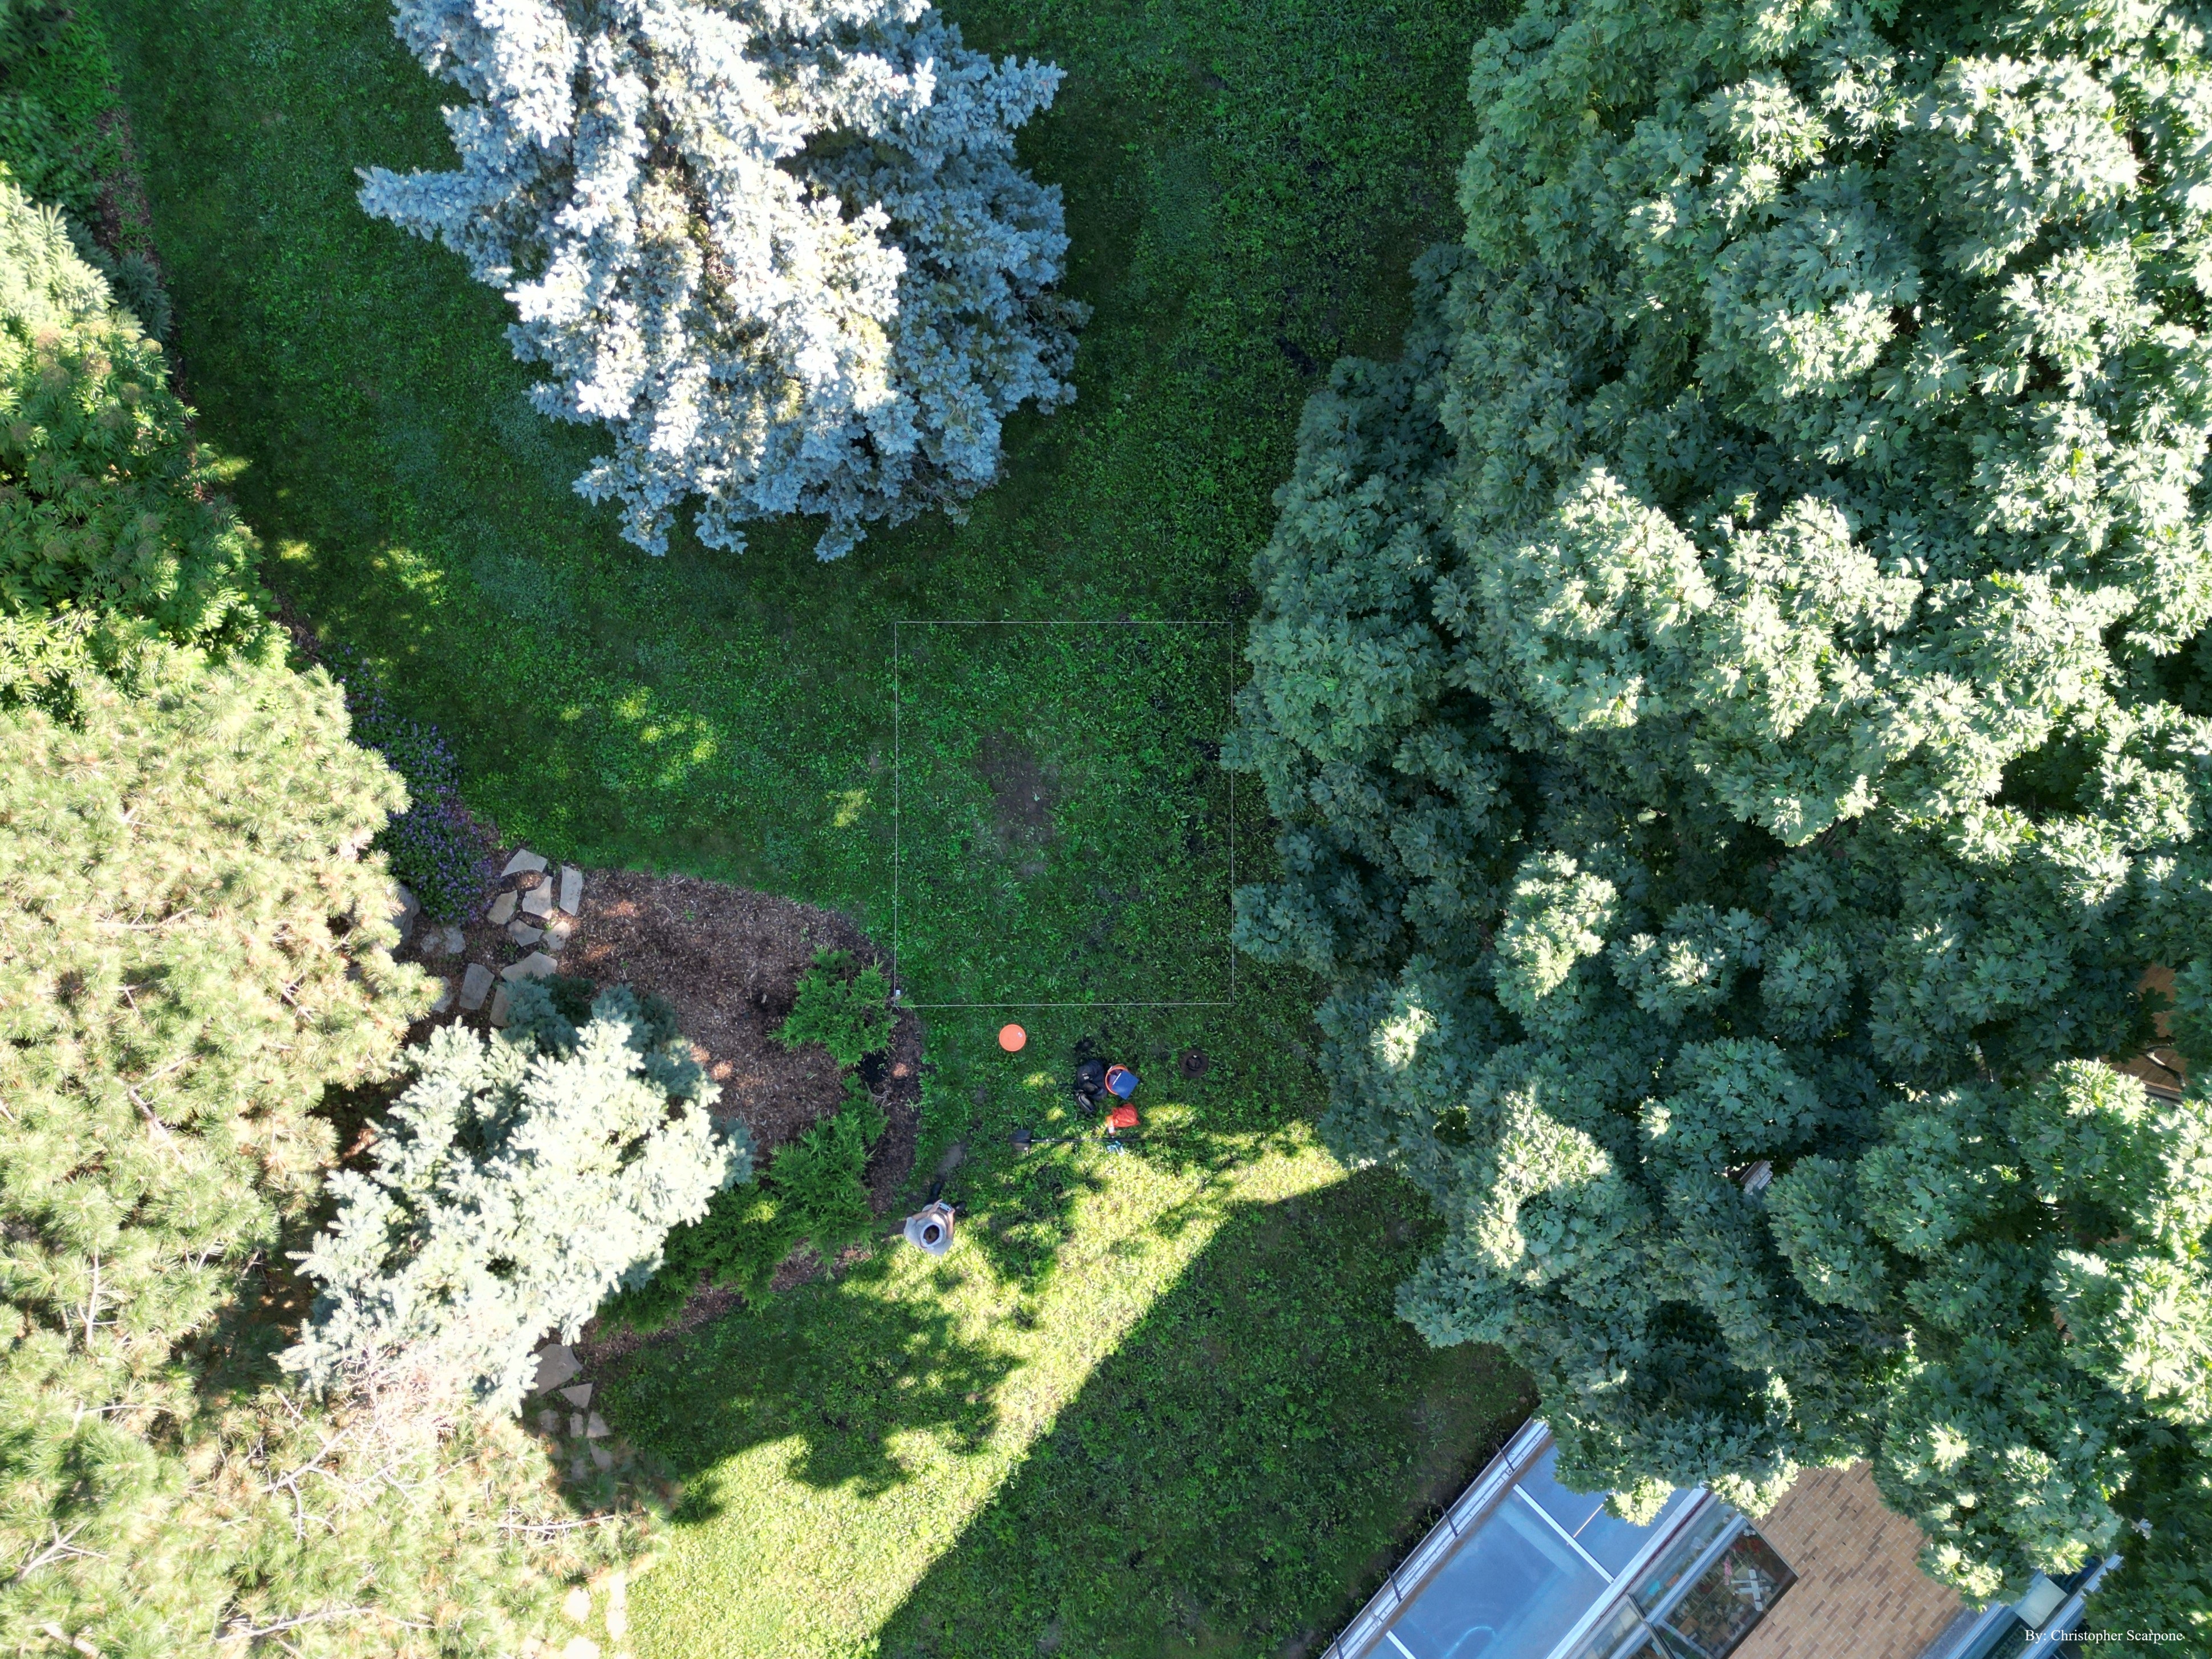 Figure 1: Contextualizing LiDAR suitability maps with physical soil profile assessments.
- Targeted Reforestation: We evaluated how well specific native species would perform based on the local soil constraints and topography.
The Impact
By moving beyond a standard, one-time map, we provided the client with a dynamic view of their landscape.
- Clear Change Hotspots: High-resolution maps explicitly showing where the canopy architecture shifted.
- Proactive Maintenance: Clear summaries of areas requiring immediate structural pruning or hazard mitigation.
- Resilient Planting: A data-driven guide identifying exactly where to plant specific native species for maximum survival rates.
This approach empowered the institution to move from reactive maintenance to a proactive, highly efficient urban forest strategy.
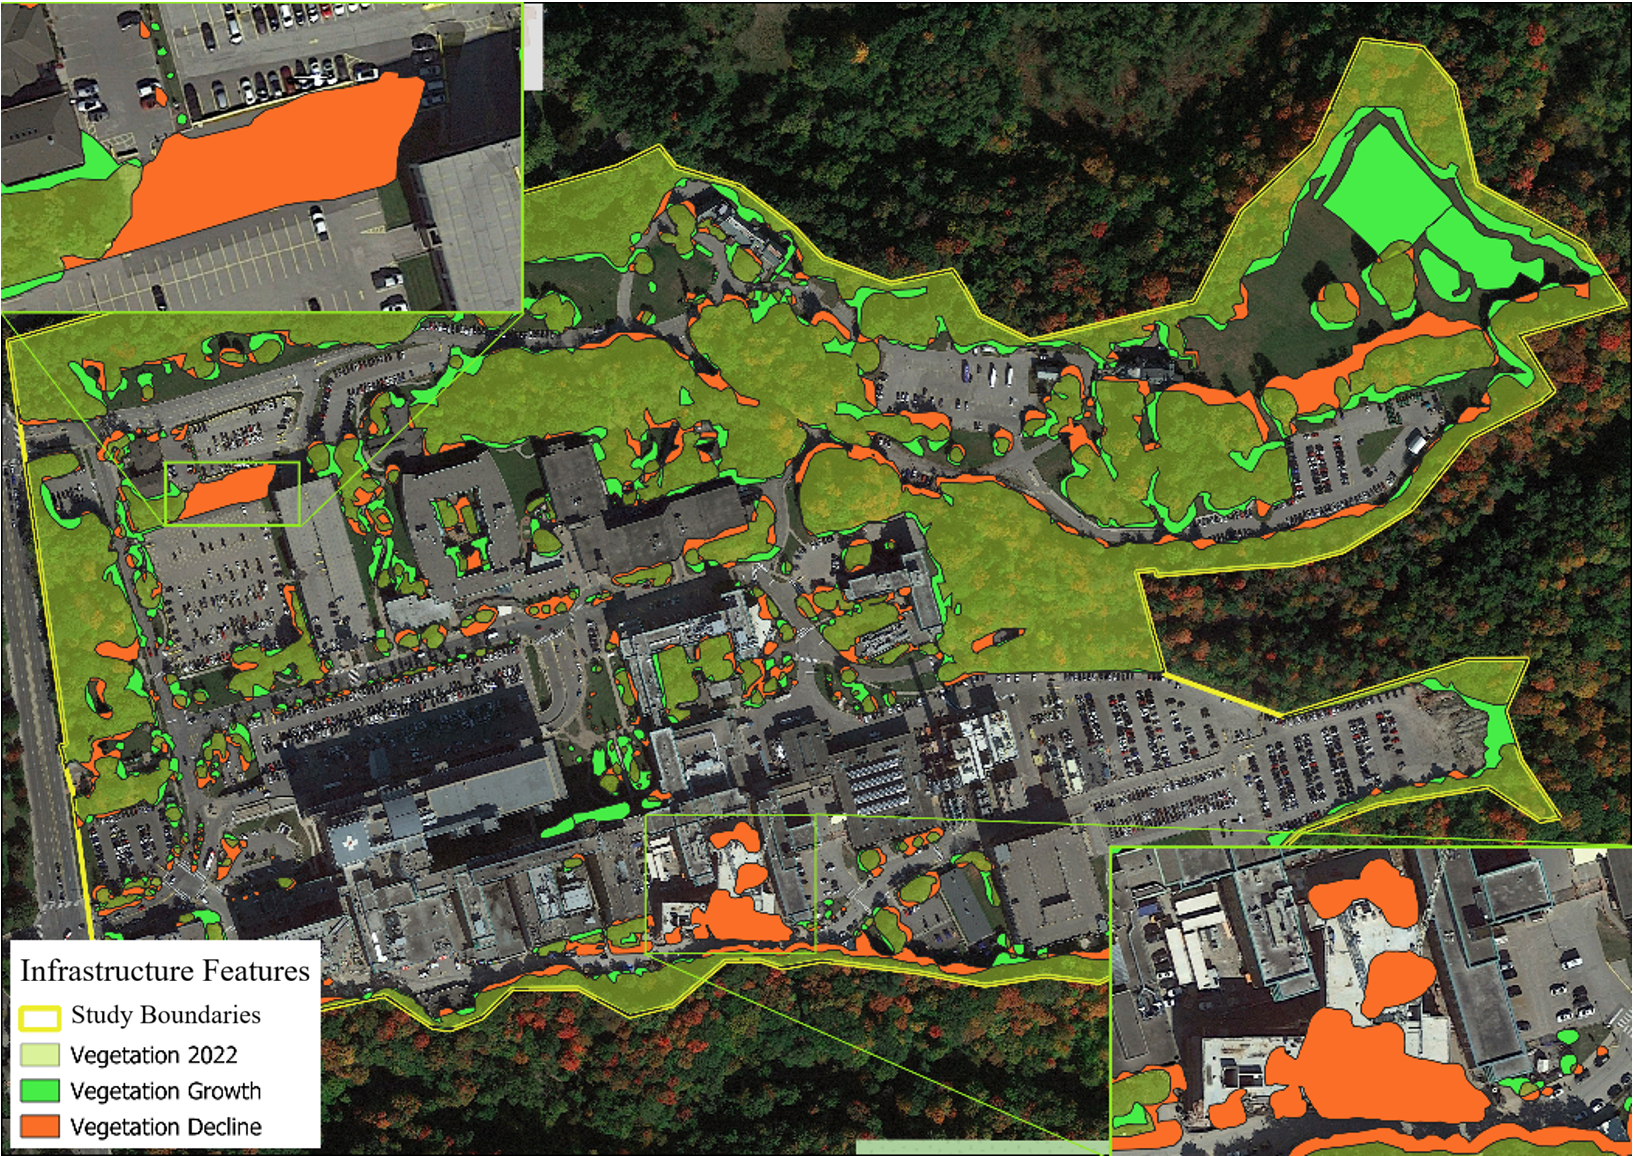 Figure 2: Change detection results showing exact locations of canopy growth and loss across the institution’s property.
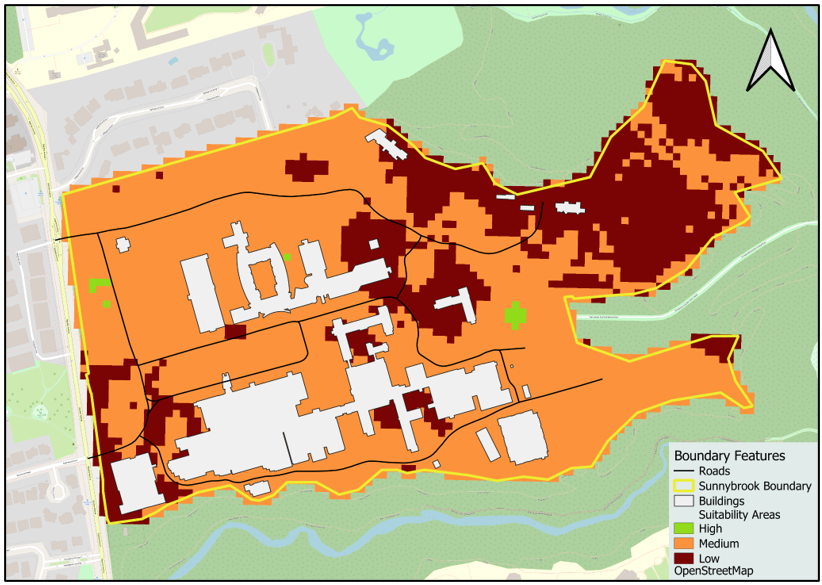 Figure 3: Suitability map identifying areas of high, medium, and low suitability for reforestation with native species, based on soil conditions and topography.
Have a similar monitoring need?
If you have historical datasets and need clear, defensible risk intelligence, let's discuss a feasibility review.